In late 2001, a group of South Australian metropolitan public and private hospitals commenced voluntary contribution of data on in-hospital utilisation of antimicrobials to the Communicable Disease Control Branch of the Department of Human Services. Where possible, hospitals contributed data on all antimicrobials dispensed for use within the institution each month. These data were stratified into antimicrobials issued to intensive care units and antimicrobials issued to all other areas within the hospital. In the first instance, only data relating to four antimicrobial classes have been analysed. These classes are third or fourth generation cephalosporins, carbapenems, glycopeptides and fluoroquinolones. Utilisation of these four classes was presented as a monthly utilisation rate i.e., total defined daily doses for each antimicrobial class per month per 1,000 occupied bed days. These utilisation rates were calculated for each individual hospital and for the combined group of contributing hospitals (state-wide rate). Although limited data are currently available, results to date demonstrate a much higher antimicrobial usage rate in intensive care units than other in-patient areas for the classes currently analysed. Considerable variation in the usage of various antimicrobials has been noted for individual hospitals, and analysis of trends over a longer time period, in conjunction with resistance surveillance data, will be required. Commun Dis Intell 2003;27 Suppl:S19-S27.
Top of page
Introduction
Antimicrobial resistance is now regarded as a significant and growing threat to public health worldwide. The emergence and dissemination of antimicrobial resistant organisms are known to be associated with antimicrobial use, and various strategies have been developed in recent years to alter antibiotic usage patterns to assist in the containment of this problem.
Educational programs, including the development and promulgation of evidence-based clinical guidelines; continuing education sessions and media-based programs aimed at promoting more rational antibiotic use and feedback on prescribing to individual clinicians have been developed for use in both community and health-care settings, with variable success.1,2,3,4,5,6 In some institutions, restrictive measures such as antibiotic cycling, formulary restriction of certain antibiotics and the implementation of stop-orders and 'prior approval' requirements, either involving computer-based programs or requiring specialist consultation, have also been employed in an attempt to modify prescribing patterns.7,8,9 Dosing based on pharmacokinetic and pharmacodynamic parameters has also been proposed as a potential tool to minimise resistance to some antimicrobial classes.10,11
Broad-based surveillance of both antimicrobial resistance and antimicrobial consumption has now been recognised as essential for planning future strategies aimed at controlling resistance. Programs for the surveillance of antimicrobial resistance and antimicrobial usage have been recommended by the World Health Organization,12,13 the European Union14 and the Centers for Disease Control and Prevention15 in the United States of America USA). The European Surveillance of Antibiotic Consumption project has recently been set up to co-ordinate international surveillance and promote world-wide collaboration.16 In the USA, the Centers for Disease Control and Prevention Hospital Infections Program began Project ICARE (Intensive Care Antibiotic Resistance Epidemiology) in 1994 to provide data on the prevalence of antibiotic resistance and antibiotic use in USA hospital settings.17
In Australia, the Joint Expert Technical Advisory Committee on Antibiotic Resistance (JETACAR), a group of 15 experts from public health, human medicine, veterinary medicine, molecular biology and primary industries, was formed by the Commonwealth Government in December 1997. The final JETACAR report,18 released in October 1999, concluded that the use and overuse of antibiotics in human medicine is the major factor contributing to the development of antibiotic resistance. The Commonwealth Government Response to the Report of the JETACAR,19 published in August 2000, supported the surveillance of both antimicrobial-resistant organisms and antimicrobial consumption at a national level, and invited proposals for the development of such programs.
In response to recommendations resulting from the JETACAR report, surveillance systems for antimicrobial utilisation, multi-resistant organisms, and other organisms linked to antimicrobial use, were established within the Communicable Disease Control Branch of the Department of Human Services in South Australia in late 2001. These surveillance systems incorporate data from major metropolitan public and private hospitals in South Australia, and will allow antimicrobial utilisation data to be linked with the incidence of particular organisms within the same institution. Published data suggest that concomitant surveillance of both antibiotic resistance and antimicrobial use is helpful in interpreting resistance patterns within a particular unit or hospital.20
This paper describes the methods used and problems encountered in setting up an antimicrobial surveillance program to monitor in-patient antibiotic usage in major South Australian metropolitan hospitals. A brief summary of preliminary data obtained from contributing hospitals is provided, however, interpretation of these data is at present limited by the short time period over which data has been collected and a correlation with resistance surveillance data has not yet been examined.
Top of page
Methods
The antimicrobial utilisation surveillance program in South Australia was initially modelled on Project ICARE17 in the USA, with data submitted by contributing hospitals stratified into use by the intensive care unit (ICU) and pooled use by other in-patient areas (non-ICU). Outpatient use, and use by day-stay or home treatment units are not included. ICU data have not been stratified by ICU type, as in Project ICARE, due to the small number of ICUs involved. Stratification of non-ICU data by clinical unit is limited by the ability of pharmacy service providers to provide accurate unit specific data, and in most contributing institutions this is not possible.
All contributors supply antimicrobial usage data on a voluntary basis. Usage reports for all antimicrobials are generated each month by the pharmacy departments of public hospitals or contracted pharmacy service providers for private hospitals. Details of the in-hospital consumption of oral and parenteral antimicrobials are provided, in terms of units or packs used for each dosage form and strength.
For larger hospitals with ICUs, data are supplied separately for this area, and pooled for other in-patient areas (non-ICU). Where a small number of designated ICU beds are incorporated into the same area as high dependency or coronary care beds, specific data relating to ICU use cannot be obtained, and all usage is pooled to provide total hospital usage rates.
Data collection has been complicated by the four different computerised pharmacy dispensing systems used by contributors, with the reporting format depending on the system used by the pharmacy. Datasets are transmitted electronically to the Communicable Disease Control Branch each month and centrally loaded into a FoxPro database for calculation of usage density rates. The database has been specifically designed to accept data generated by different pharmacy systems, whether dispensing is by individual unit of use or by manufacturer's pack, as is the case where the Pharmaceutical Benefits Scheme is involved. Usage density rates for each antimicrobial agent are calculated using the total number of grams of the antimicrobial used, the defined daily dose for that antimicrobial, and the number of occupied bed days as provided by the contributor.
The usage density rate is defined as the number of defined daily doses used per 1,000 occupied bed-days and is calculated as follows:
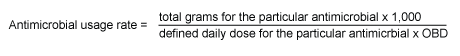
Defined daily doses assigned by the WHO21 have been used to enable benchmarking with European centres in the future, although some values may not be consistent with common clinical practice in Australia.
Although most contributing hospitals have supplied data for a broad range of antimicrobials, usage rates are currently reported for only four antimicrobial classes: third or fourth generation cephalosporins (ceftriaxone, cefotaxime, ceftazidime, cefepime), carbapenems (meropenem, imipenem), glycopeptides (vancomycin, teicoplanin) and fluoroquinolones (ciprofloxacin, gatifloxacin, moxifloxacin, norfloxacin). Rates are reported both for individual antimicrobial agents and pooled rates for antimicrobial classes. Reporting of additional classes will be undertaken as required by participating hospitals.
Although formal reports had not been distributed at the time of submission of this paper, discussions with interested clinicians had taken place and a format for data presentation was agreed upon. Programming to enable automated monthly reporting is now underway. Monthly reports will be forwarded to each contributor, displaying hospital and state-wide usage for total hospital, ICU and non-ICU for each of the four antimicrobial classes, and will also provide usage rates for individual agents within classes.
State-wide utilisation rates are calculated for the total group of contributing hospitals for the purpose of comparison. Individual contributing hospitals, however, have access only to their own rates and to the pooled state-wide rate to ensure confidentiality. Benchmarking with other Australian or overseas antimicrobial utilisation data is planned for the future.
Top of page
Results
The limited results presented in this report have been calculated from antimicrobial utilisation data supplied by the eight hospitals for the period November 2001 to May 2002. Five of these hospitals had ICUs. Six public and two private hospitals are included. One paediatric hospital and two private hospitals with incomplete datasets for that time period have been excluded.
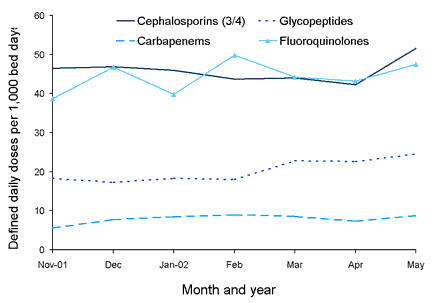
The state-wide rates for the period November 2001 to May 2002 for each of the four reported antimicrobial classes are shown in Figure 1. Monthly state-wide usage rates have not shown large variations to date.
Figure 1. State-wide usage rates for total hospital use of third or fourth generation cephalosporins, glycopeptides, carbapenems and fluoroquinolones
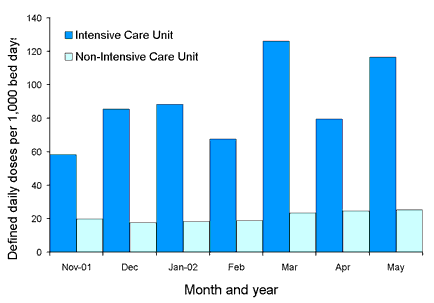
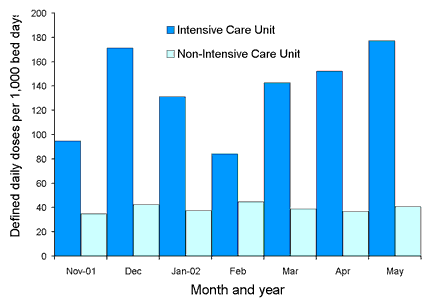
Comparative state-wide rates for ICU and non-ICU usage for the four classes are shown in Figures 2, 3, 4 and 5. Antimicrobial usage rates for ICUs in all contributing hospitals are markedly higher than rates for pooled usage in other hospital areas for the antibiotic classes currently reported.
Top of page
Figure 2. State-wide usage rates for Intensive Care Unit and non-Intensive Care Unit use of third or fourth generation cephalosporins (includes ceftriaxone, cefotaxime, ceftazidime and cefepime)
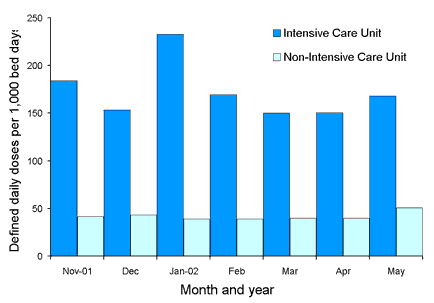
Figure 3. State-wide usage rates for Intensive Care Unit and non- Intensive Care Unit use of glycopeptides (includes vancomycin and teicoplanin)
Top of page
Figure 4. State-wide usage rates for Intensive Care Unit and non- Intensive Care Unit use of carbapenems (includes meropenem and imipenem-cilastatin)
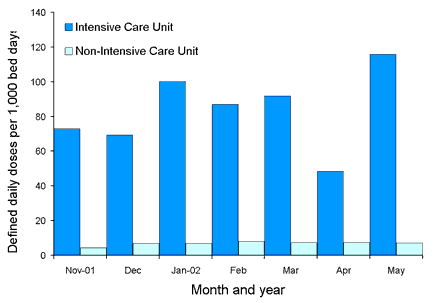
Figure 5. State-wide usage rates for Intensive Care Unit and non- Intensive Care Unit use of fluoroquinolones (includes ciprofloxacin, gatifloxacin, moxifloxacin and norfloxacin)
Top of page
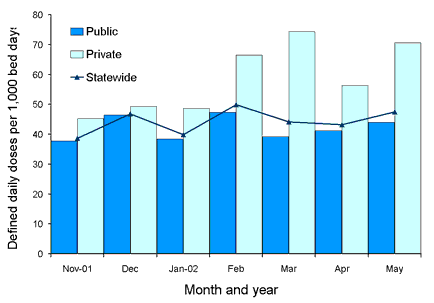
Figures 6 and 7 show comparative usage rates for third or fourth generation cephalosporin and fluoroquinolone classes for public and private hospitals, as well as corresponding state-wide rates, with preliminary data suggesting higher usage rates in some private hospitals in comparison with public hospitals for some antimicrobials, as shown in Figures 6 and 7. These rates have been calculated using pooled preliminary data for the six public and two private hospitals included in this report.
Figure 6. Usage rates for individual third and fourth generation cephalosporins in a public hospital Intensive Care Unit
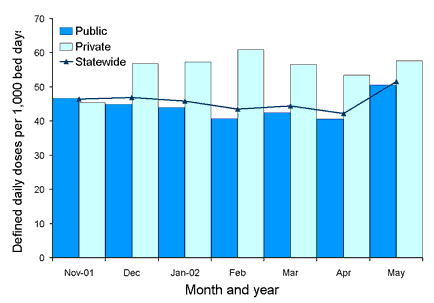
Figure 7. Usage rates for individual third and fourth generation cephalosporins in a private hospital Intensive Care Unit
Top of page
Discussion
It is anticipated that complete data will be available for 13 hospitals in the near future. Although paediatric usage data has been submitted by one specialist paediatric hospital, analysis of such data is difficult due to the lack of standard defined daily doses applicable to the paediatric population. Usage is therefore reported as total grams used per month for particular antimicrobials. While utilisation rates are currently presented in the form of simple charts showing both hospital and state-wide usage rates over time, it is anticipated that more sophisticated models may be used when a larger pool of data is available for analysis. Use of these models may enable linking of both antimicrobial usage and resistance surveillance data.
22,23 Comparison of South Australian usage with European and possibly other Australian centres is planned, however, differences in antimicrobial groupings analysed and defined daily doses used in other centres have made this impractical at present.
As limited data are available for analysis at this stage and no specific recommendations for intervention programs have as yet been made, some areas for future consideration have been identified. The high usage rates for third generation cephalosporins, particularly ceftriaxone and cefotaxime, by most contributors, may require the introduction of intervention programs on a state-wide basis.
Further comparisons between prescribing patterns in the private and public sectors are also planned for the future. It should be noted, however, that complete data for only two private hospitals were available for analysis at the time of preparation of this paper. While mechanisms such as restricted formularies and prior approval requirements may be implemented in public hospitals to influence prescribing, in the private sector the Pharmaceutical Benefits Scheme restrictions are currently the only regulatory mechanism in place. Interventions to modify prescribing practices in the private sector are therefore limited to education. A regulatory mechanism at state level may be necessary in the future if antimicrobial use is to be successfully controlled in both the public and private settings.
Reporting of antimicrobial usage rates for specific hospital areas or units would enable greater comparison between similar hospitals, or particular units within hospitals. The identification of specific wards or units such as haematology or specialised transplant units, where there is high usage of antimicrobials, may be a future focus for collection and analysis of unit-specific data where this can be accurately provided. For general surgical or medical wards, accurate data are difficult to obtain due to the complex or diverse patient mix within these areas. At present in South Australia, no hospital is able to provide complete, accurate data for antimicrobial consumption at the individual patient level.
The expansion of resistance and antimicrobial utilisation surveillance programs to include data from regional centres may reveal differences in the prevalence of resistance and antimicrobial usage patterns compared with metropolitan hospitals.
The initial phase of the program has highlighted many problems relating to the availability of the required data. The use of the Pharmaceutical Benefits Scheme by private hospitals, the diversity of computer systems and methods of cataloguing drugs within the participating group of hospitals, have necessitated the design of a central program to accept and analyse data presented in a number of different formats. If larger programs involving both hospital and community use are to be instituted in the future it will be necessary to ensure that data can be collected in a standardised format. Future introduction of new pharmacy computer systems in the public or private sectors may represent an opportunity to institute standardisation of drug cataloguing, perhaps using the World Health Organization Anatomical Therapeutic Chemical code.21 Incorporation of a standard reporting function into such systems would facilitate regular reporting of usage data for antimicrobials and other drug groups.
Hospitals are encouraged to use caution when comparing their own usage rates with those for the pooled state-wide data, as significant differences exist in casemix complexity and in the burden of multi-resistant organisms between hospitals contributing data to this program.
It is hoped that this program will assist participating hospitals identify areas where quality improvements in antimicrobial use can be made, and encourage restraint in the use of certain antimicrobial classes, particularly within the ICU setting. Analysis of antimicrobial usage data in conjunction with resistance surveillance data may enable planning of more effective strategies to combat antimicrobial resistance.
Top of page
Acknowledgements
Mr Chris Horwood for developing and managing the database and assisting with other aspects of the project.
Top of page
References
1. Centers for Disease Control and Prevention campaign to prevent antimicrobial resistance in health-care settings. MMWR Morb Mortal Wkly Rep 2002;51:343.
2. Emmer CL, Besser RE. Combating antimicrobial resistance: intervention programs to promote appropriate antibiotic use. Infect Med 2002;19:160-173.
3. Sbarbaro JA. Can we influence prescribing patterns? Clin Infect Dis 2001;33 Suppl 3:S240-S244.
4. Watson DA. Antibiotic guidelines: improved implementation is the challenge. Med J Aust 2002;176:513-514.
5. Bell DM. Promoting appropriate antimicrobial drug use: perspective from the Centers for Disease Control and Prevention. Clin Infect Dis 2001;33;Suppl 3:S245-S250.
6. Wilton P, Smith R, Coast J, Millar M. Strategies to contain the emergence of antimicrobial resistance: a systematic review of effectiveness and cost-effectiveness. J Health Serv Res Policy 2002;7:111-117.
7. Empey KM, Rapp RP, Evans ME. The effect of an antimicrobial formulary change on hospital resistance patterns. Pharmacotherapy 2002;22;81-87.
8. Lawton RM, Fridkin SK, Gaynes RP, McGowan JE Jr. Practices to improve antimicrobial use at 47 US hospitals: the status of the 1997 SHEA/IDSA position paper recommendations. Society for Healthcare Epidemiology of America/Infectious Diseases Society of America. Infect Control Hosp Epidemiol 2000;21:256-259.
9. Landman D, Chockalingam M, Quale JM. Reduction in the incidence of methicillin-resistant Staphylococcus aureus and ceftazidime-resistant Klebsiella pneumoniae following changes in a hospital antibiotic formulary. Clin Infect Dis 1999;28:1062-1066
10. MacGowan AP. Role of pharmacokinetics and pharmacodynamics: Does the dose matter? Clin Infect Dis 2001;33 Suppl 3:S238-S239.
11. Craig WA. Does the dose Matter? Clin Infect Dis 2001;33 Suppl 3:S233-S237.
12. World Health Organization consultation on global principles for the containment of antimicrobial resistance due to antimicrobial use in livestock. Geneva, June 2000. Available from: http://www.who.int./emc/diseases/zoo/drafting.html
13. World Health Organization global strategy for containment of antimicrobial resistance. Geneva, June 2001. Available from: http://www.who.int/emc/amrpdfs/WHO_Global_Strategy_English.pdf
14. The Copenhagen Recommendations: Report from the Invitational European Union Conference on The Microbial Threat. Copenhagen: Ministry of Food, Agriculture and Fisheries. September 1998:1-52. Available from: http://www.tour.info.fr/tours/pap/articles/copen2.htm
Top of page
15. Centers for Disease Control and Prevention. A public health action plan to combat antibiotic resistance. June 2000. Available from: http://www.cdc.gov/drugresistance/actionplan/html/index.htm
16. European Surveillance of Antimicrobial Consumption. ESAC project description. Laboratory of Microbiology, University of Antwerp. Available from: http://www.uia.ac.be/esac/ESAC_project.htm Accessed: 2002.
17. Fridkin SK, Steward CD, Edwards JR, Pryor ER, McGowan JE Jr, Archibald Lk, et al. Surveillance of antimicrobial use and antimicrobial resistance in United States hospitals: project ICARE phase 2. Project Intensive Care Antimicrobial Resistance Epidemiology (ICARE) hospitals. Clin Infect Dis 1999;29:245-252.
18. Commonwealth Department of Health and Aged Care. The use of antibiotics in food-producing animals: antibiotic-resistant bacteria in animals and humans. Commonwealth Department of Health and Aged Care, Commonwealth Department of Agriculture, Fisheries and Forestry-Australia. October 1999.
19. Commonwealth Department of Health and Aged Care. Commonwealth Government response to the report of the Joint Expert Technical Advisory Committee on Antibiotic Resistance (JETACAR). Commonwealth Department of Health and Aged Care, Commonwealth Department of Agriculture, Fisheries and Forestry-Canberra, August 2000.
20. Monnet DL, Archibald LK, Phillips L, Tenovar FC, McGowan JE Jr, Gaynes RP. Antimicrobial use and resistance in eight US hospitals: complexities of analysis and modelling. Intensive Care Antimicrobial Resistance. Epidemiology Project and National Nosocomial Infections Surveillance System Hospitals. Infect Control Hosp Epidemiol 1998;19:388-394.
21. World Health Organization Collaborative Centre for Drug Statistics Methodology. Available from: http://www.whocc.no/atcddd Accessed: 2002.
22. Monnet DL, Lopez-Lozano JM, Campillos P, Burgos A, Gonzalo N. Making sense of antimicrobial use and resistance surveillance data: application of ARIMA and transfer function models. Clin Microbiol Infect 2001;7 Suppl 5:S29-S36
23. Lopez-Lozano JM, Monnet DL, Yague A, Burgos A, Gonzalo N, Campillos P, et al. Modelling and forecasting antimicrobial resistance and its dynamic relationship to antimicrobial use: a time series analysis. Int J Antimicrob Agents 2000;14:21-31.
Top of page
Author affiliations
1. Project Pharmacist, Communicable Disease Control Branch, South Australian Department of Human Services, Adelaide, South Australia
2. Head of Infection Control Service, Communicable Disease Control Branch, South Australian Department of Human Services, Adelaide, South Australia
Corresponding author: Dr Celia M Cooper, Head of Infection Control Service, Communicable Disease Control Branch, South Australian Department of Human Services, 162 Grenfell Street, Adelaide SA 5000. Telephone: +61 8 226 7177. Facsimile: +61 8 226 7187. Email: cdcb@dhs.sa.gov.au
This article was published in Communicable Diseases Intelligence Volume 27 Suppl, May 2003.
